


Comparative Dissolution Profile: A Practical Guide to Similarity Testing
2026-09-22


A Comparative Dissolution Profile determines how test and reference products release drug components at different sample times under identical conditions. The Profile is useful in determining differences between products if the variability in the results of the analysis is less than the differences in the products.

At Raytor, we take a control-oriented approach to dissolution testing. This includes controls for synchronized dosing, temperature, and sampling. These facilitating controls allow for comparisons; however, a sufficiently valid method and a defensible statistical analysis are also required to reach a conclusion.
This guide focuses on immediate-release oral solid dosage forms. Modified-release products require release-specific study designs.
1. Define the Comparative Dissolution Profile Objective
The study objective determines batch selection, test conditions, and the evidence needed.
| Application | Comparison | Main Decision |
| Generic development | Test versus reference product | Does release behavior support formulation selection? |
| Manufacturing changes | Pre-change versus post-change batches | Has the change affected dissolution? |
| Scale-up or technology transfer | Original versus transferred production | Are differences attributable to manufacturing or laboratory execution? |
| Biowaiver support | Products or strengths within an eligible pathway | Does dissolution evidence satisfy the applicable requirements? |
A single-point specification allows for release at a specific time. A Comparative Dissolution Profile analyses the profile of release. Two batches can release at the same endpoint requirement, but be completely different during the initial phase of dissolution.
The FDA's guidance documents cover comparing profiles during changes in development and in manufacture as well as in biowaiver cases. In cases where there is a mere resemblance, bioequivalence cannot be assumed.
2. Design the Study Before Generating Data
Predefine batches, apparatus, media, agitation, sampling times, statistical procedures, and acceptance criteria. Post hoc removal of unfavorable time points can distort the conclusion.
Preserve Method Discrimination
More aggressive conditions do not necessarily produce a better comparison. Excessive agitation or surfactant concentrations can reduce sensitivity to formulation differences.
| Control | Technical Assessment | Potential Consequence |
| Medium composition | pH, buffer capacity, solubility, justified surfactant level | Suppressed or exaggerated release differences |
| Hydrodynamics | Apparatus, agitation, alignment, coning | Vessel-dependent variability |
| Temperature and deaeration | Equilibration, temperature stability, bubbles | Changes in dissolution behavior |
| Sampling | Position, timing, volume, replacement | Biased profile shape or cumulative release |
| Analytical method | Specificity, range, recovery, stability | Concentration bias unrelated to formulation |
Validate the Sampling Path
Sampling performance must be assessed in relation to vessel conditions during a Comparative Dissolution Profile analysis.
• Filter Recovery: Analyze adsorption in the significant concentration range and determine the waste disposal volume.
• Sample Stability: Check the holding times during which the sample is stable prior to analysis.
• Automated Lines: Analyze transport delays, flushing, residual volume and carryover.
• Volume Correction: Consider the drug removed from the vessel and the change in the volume of the drug in the vessel.
With an equal-volume replacement, the cumulative dissolved mass at sample (n) is given by:
M_n=C_nV+v\sum_{i=1}^{n-1}C_i
Where (V) is the volume of the vessel and (v) is the volume withdrawn. This is valid for complete mixing, a drug-free replacement medium and negligible losses.
3. Select an Applicable Similarity Method
Check Rapid Dissolution First
For applicable immediate-release oral products with systemic action, both products dissolving more than 85% within 15 minutes may support similarity without further mathematical evaluation.
Apply f2 Only to Eligible Data
The conventional similarity factor is:
f₂ = 50 · log₁₀ ( 100 / √[1 + (∑(R_t - T_t)²) / n] )
(R_t) and (T_t) represent mean percentages dissolved at matching times. Values of 50–100 support similarity when the method's prerequisites are met.
EMA specifies:
• At least three nonzero, matching time points.
• At least 12 individual values per product at each point.
• No more than one mean value above 85% for either formulation.
• CV below 20% at early points through 10 minutes and below 10% thereafter.
Follow the applicable guidance's data-inclusion rules; do not combine differing regulatory conventions.
Address High Variability Explicitly
When conventional f2 is unsuitable, EMA describes Bootstrap analysis of expected f2 using at least 5,000 resamples. Its criterion is a lower 90% confidence limit of at least 50. Predefine the procedure and document software settings. See EMA's dissolution comparison guidance.
| Finding | Appropriate Response |
| Eligible rapid dissolution | Assess whether mathematical comparison is unnecessary |
| Conventional f2 prerequisites satisfied | Calculate f2 and review underlying data |
| Excessive variability | Use a justified, predefined alternative |
| Sampling or analytical bias suspected | Investigate data validity first |
4. Interpret the Comparative Dissolution Profile Beyond f2
Include individual profiles along with means and variability. An acceptable average can mask inconsistent behavior of units.
For example, if you see a profile with a slower early dissolution followed by a final release, you should investigate disintegration, wetting, coating, and particle properties.
• Profiles with similar releases: Support release under the tested conditions without needing to prove identical mechanisms.
• Profiles with different releases: Should be investigated, and do not, by themselves, prove clinical inequivalence.
5. Investigate Differences Systematically
| Observation | Priority Checks |
| Early-time divergence | Dosing synchronization, disintegration, sampling delay |
| Persistent vessel anomaly | Mechanical condition, bubbles, floating, coning |
| Low measured recovery | Adsorption, degradation, line losses, calculations |
| Batch-wide shift | Raw materials, granulation, compression, coating |
| Manual–automated disagreement | Timing, filtration, flushing, carryover |
Repeat testing should follow an evidence-based investigation.
6. Implement a Controlled Workflow With Raytor
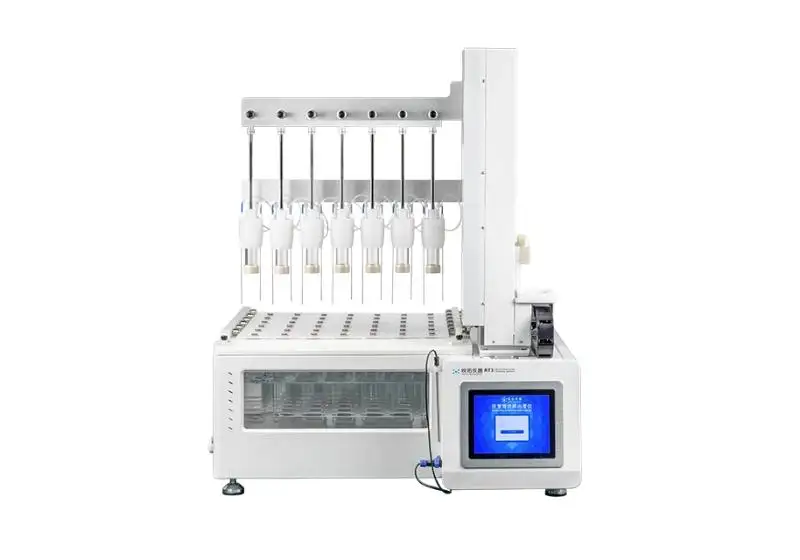
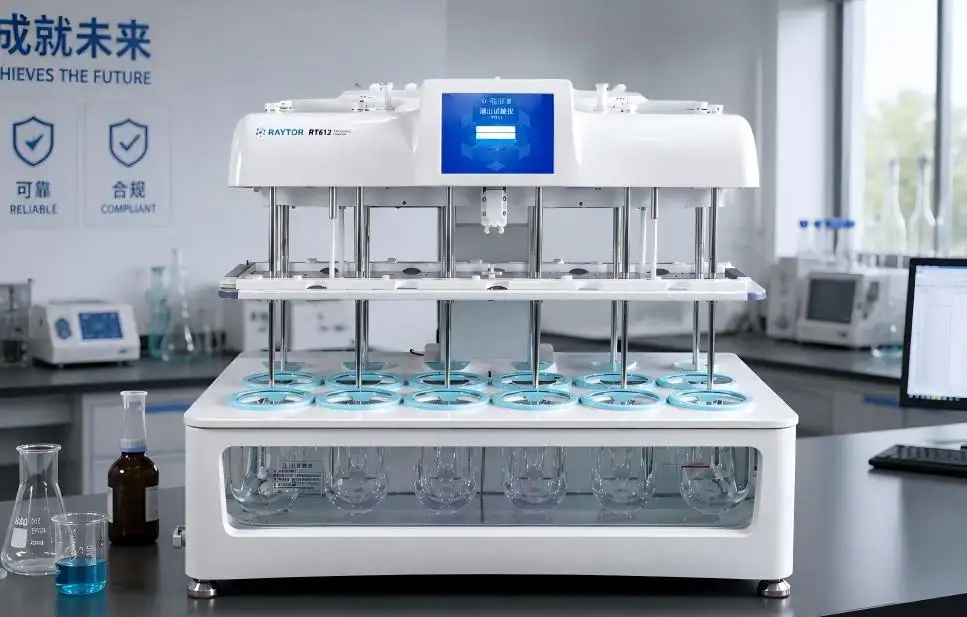
Our RT600 provides synchronized dosing; RT612 supports individual temperature monitoring; RT600-ST offers automated sampling and filtration configurations. These capabilities address practical execution needs, subject to application-specific verification.
Retain individual results, variability, conditions, calculations, deviations, and the conclusion's rationale in the study report.
A dependable Comparative Dissolution Profile starts with controlled measurements. Explore Raytor's pharmaceutical dissolution solutions to discuss a configuration aligned with your dosage forms, sampling schedule, and laboratory workflow.
FAQs
Q1. Which Raytor Instruments Can Support Comparative Dissolution Profile Studies?
Raytor offers the RT600 and RT612 dissolution apparatus, alongside automated systems such as the RT600-ST and RT612-ST. Selection should reflect the dosage form, required apparatus, sample throughput, and sampling procedure.
Q2. How Does the Raytor RT600 Support Consistent Test Initiation?
The RT600 features automatic synchronized dosing, helping control differences in test start times between vessels. This is particularly relevant when early dissolution changes rapidly and small timing differences can affect profile comparison.
Q3. What Does the Raytor RT612 Offer for Temperature Monitoring?
The RT612 provides individual temperature monitoring and real-time monitoring of key operating parameters. These features help laboratories assess whether test conditions remain consistent throughout a Comparative Dissolution Profile study.
Q4. Can Raytor Automate Multi-Time-Point Dissolution Sampling?
Yes. Raytor's automated dissolution systems, including the RT600-ST, provide sampling and filtration capabilities. Laboratories should verify sampling accuracy, transport delay, filter recovery, and carryover for each intended application.
Q5. What Should Laboratories Validate Before Using Raytor Automated Sampling?
Validation should address the actual withdrawal time, sample volume, filtration recovery, line flushing, residual volume, and sample stability. A justified comparison with the established sampling procedure can help identify automation-related bias.